Illusteret videnskab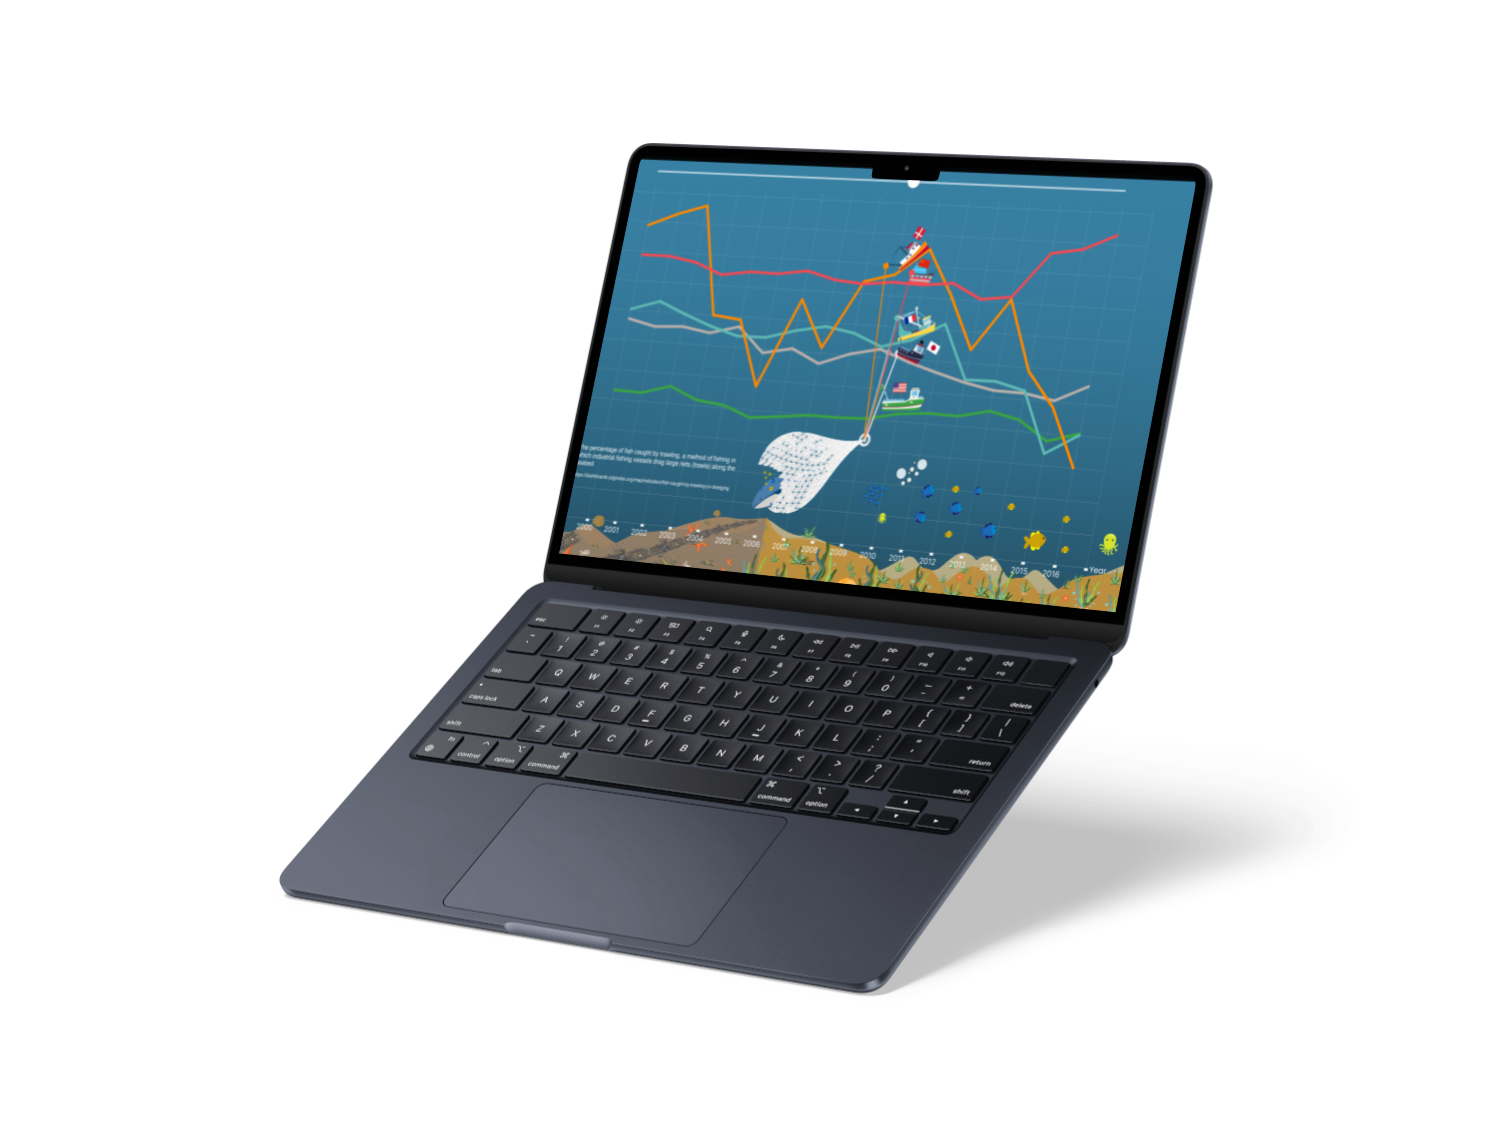
Illustreret videnskab
Challenge:
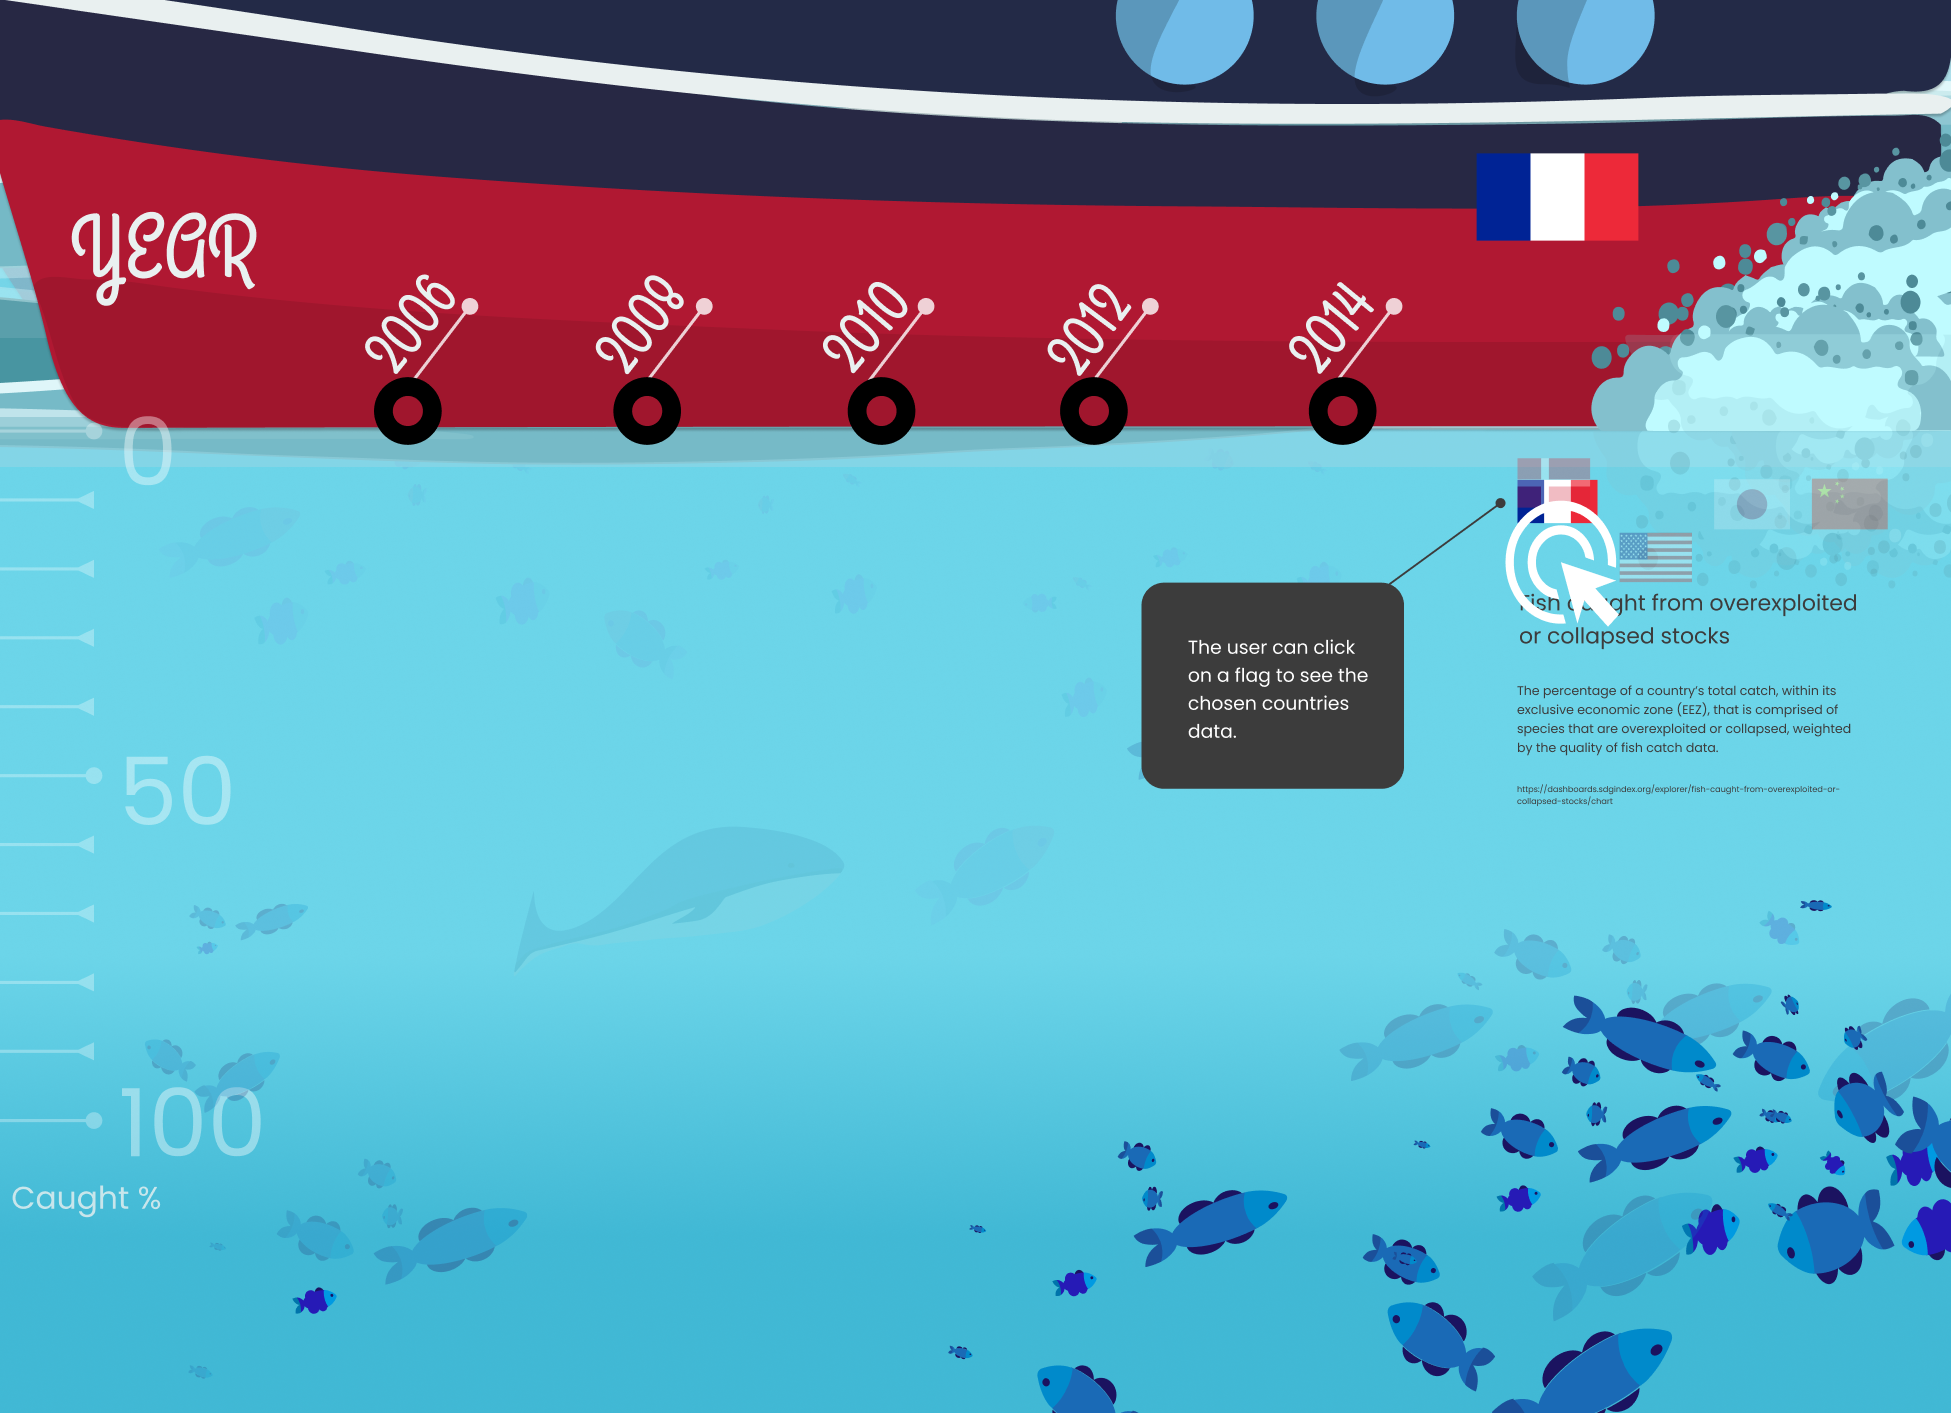
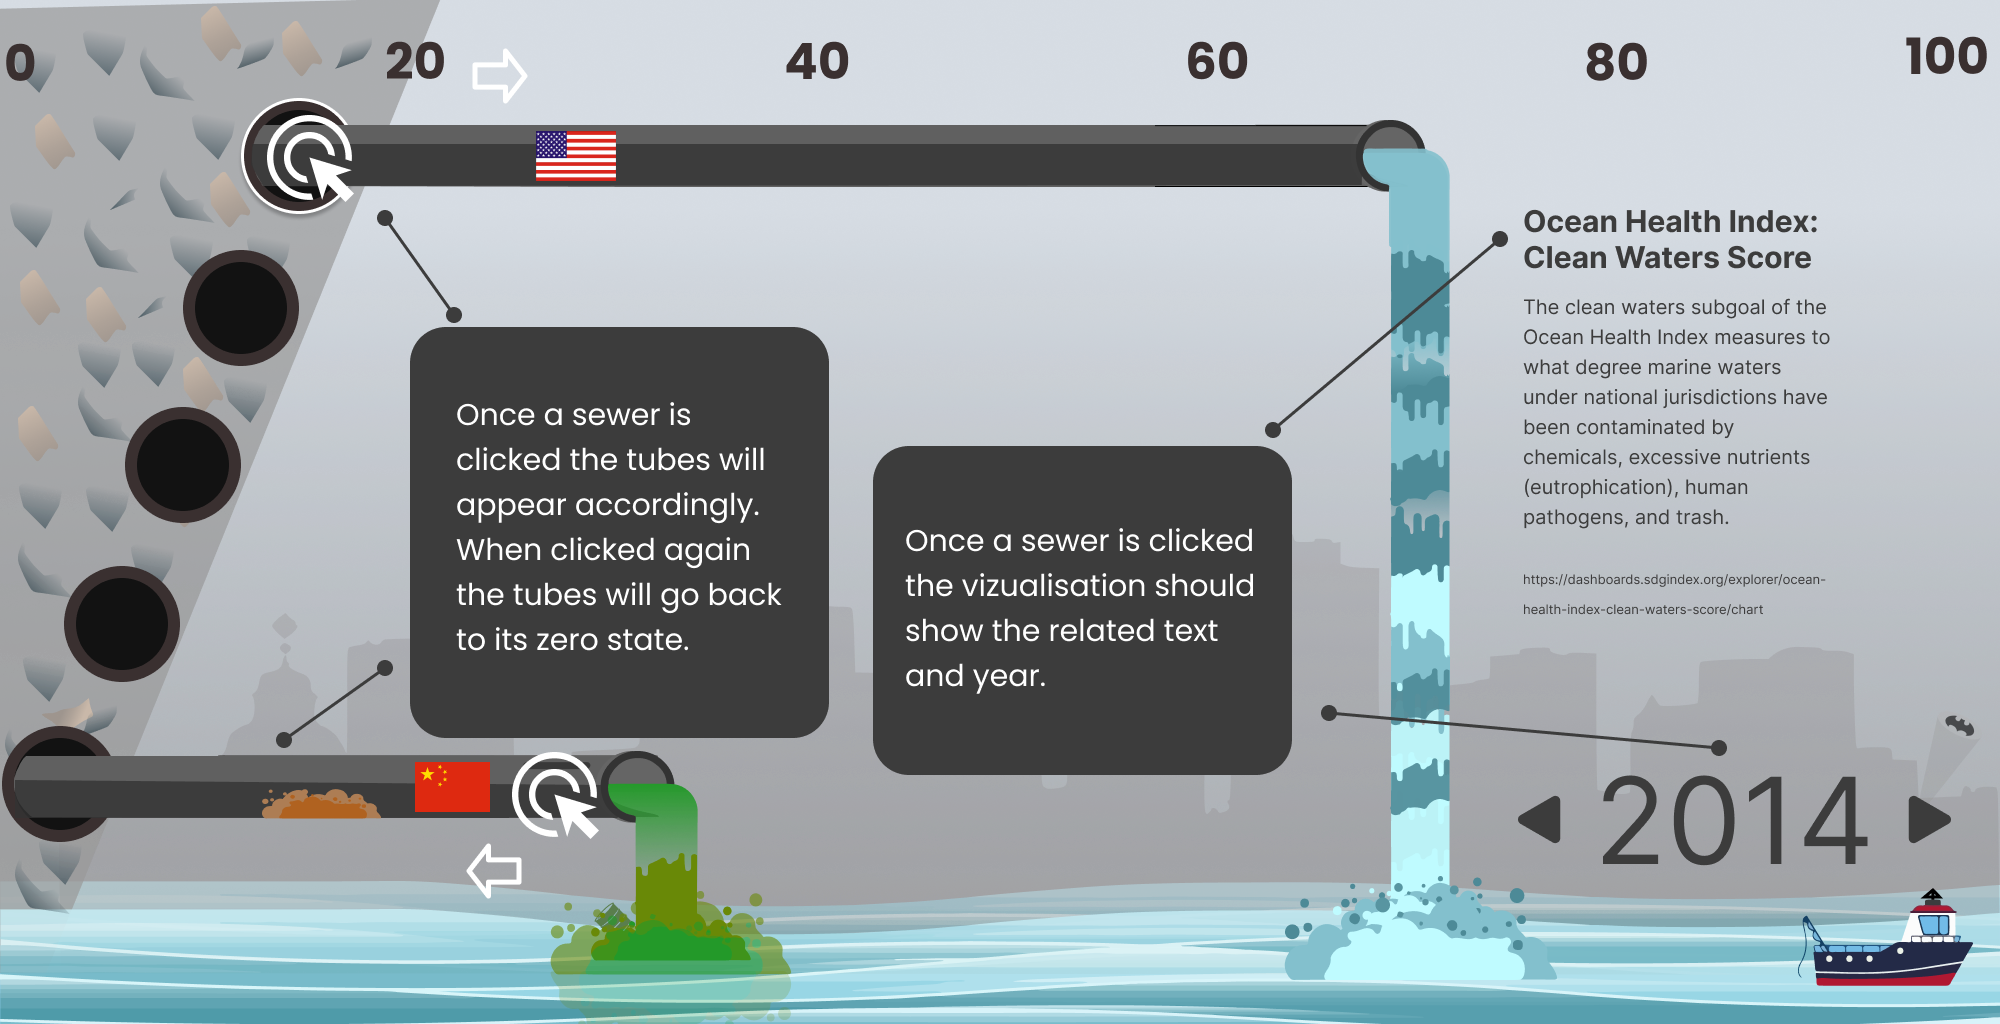
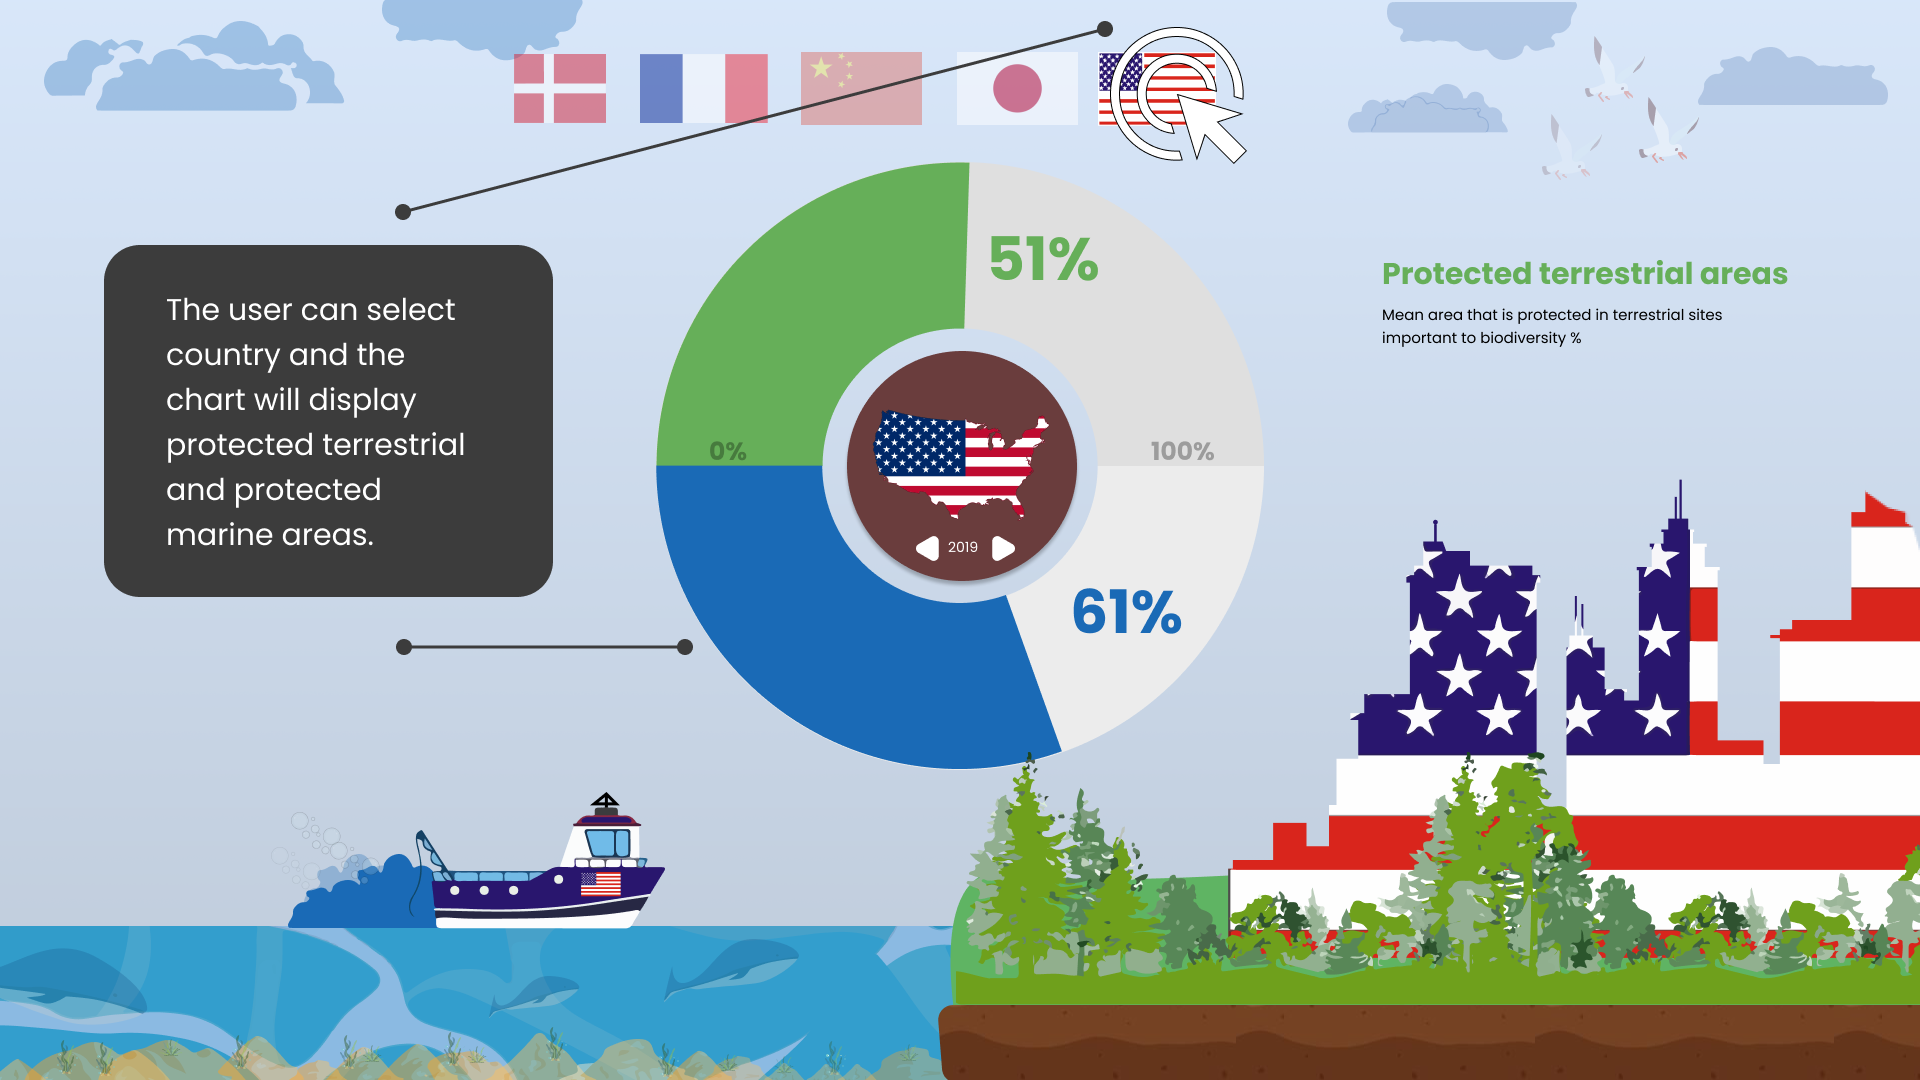
The task was to communicate data related to the UN Sustainable Development Goals in a relatable way. My project group and I chose to focus on goal no. 14, Life Below Water.
In the process, we worked with the data visualisation tools Tableau and Figma to transform complex data to be communicated in a receptive way.
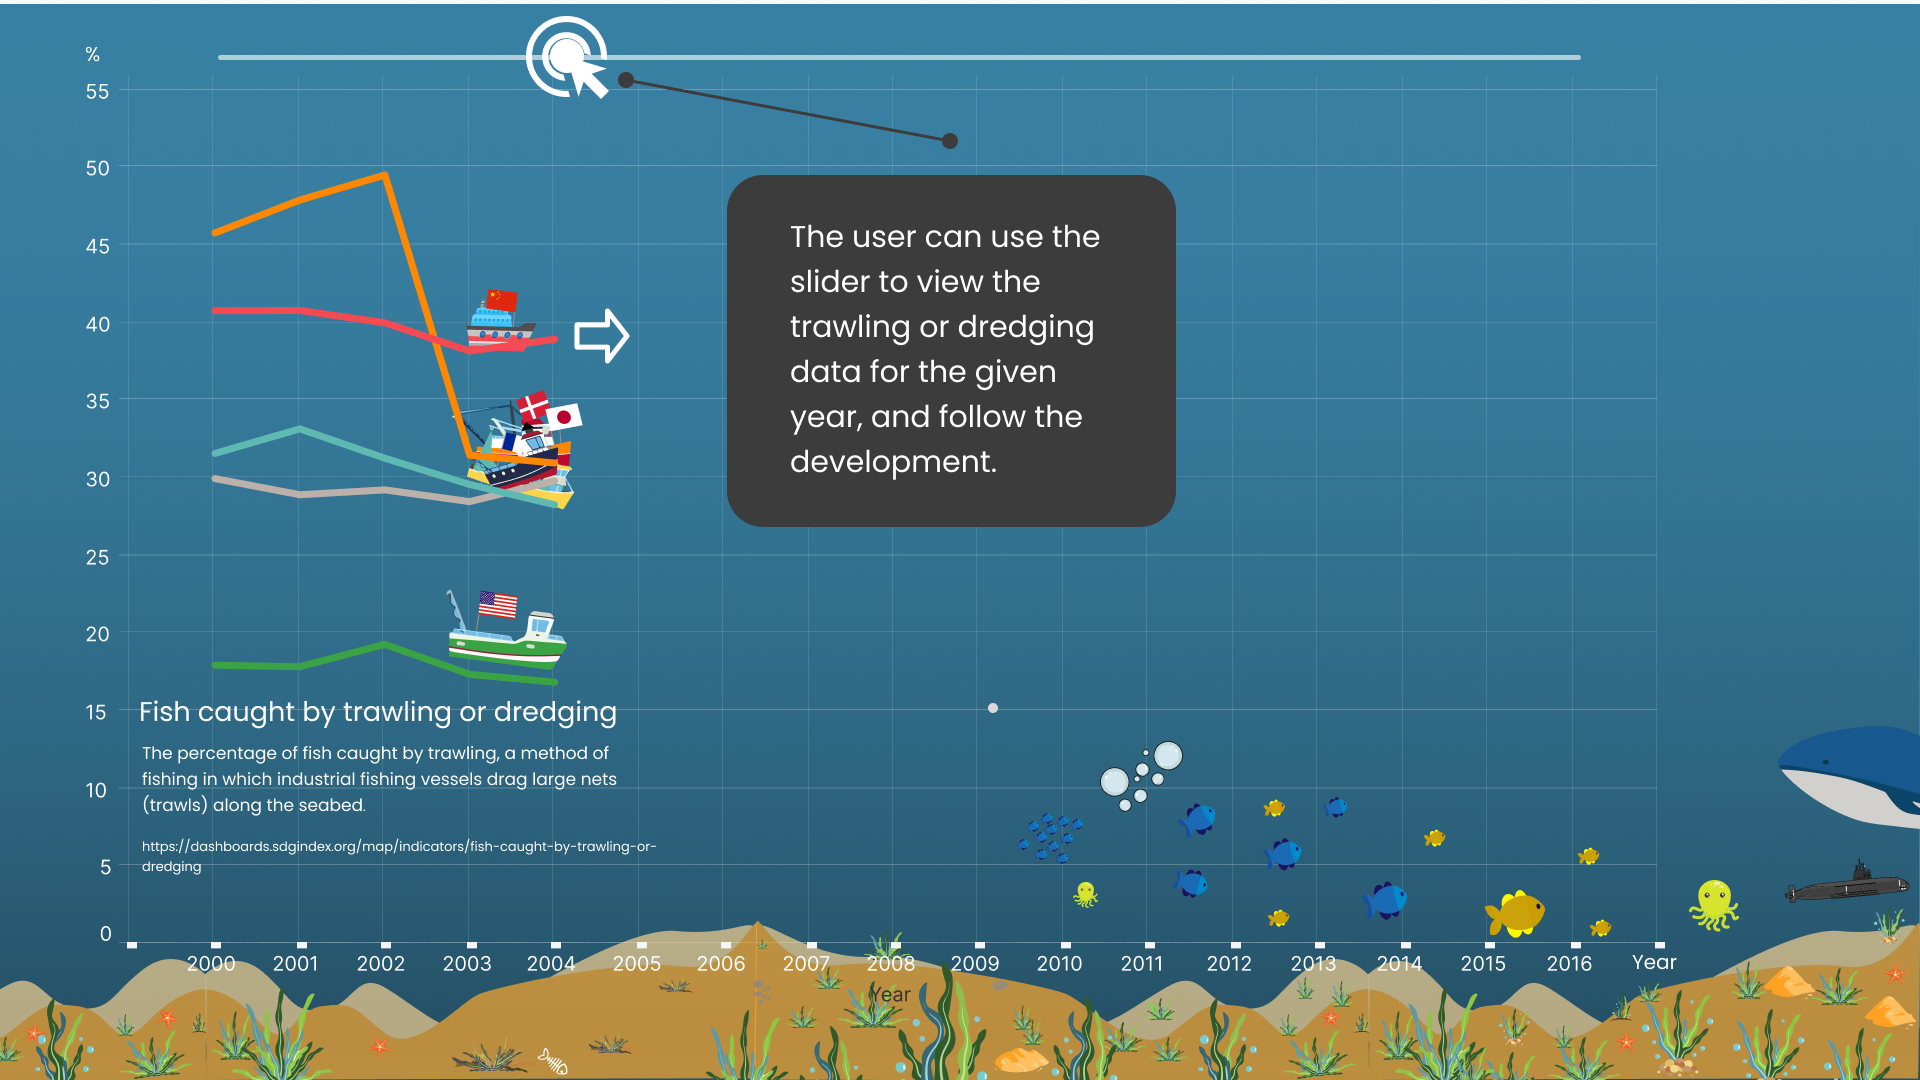
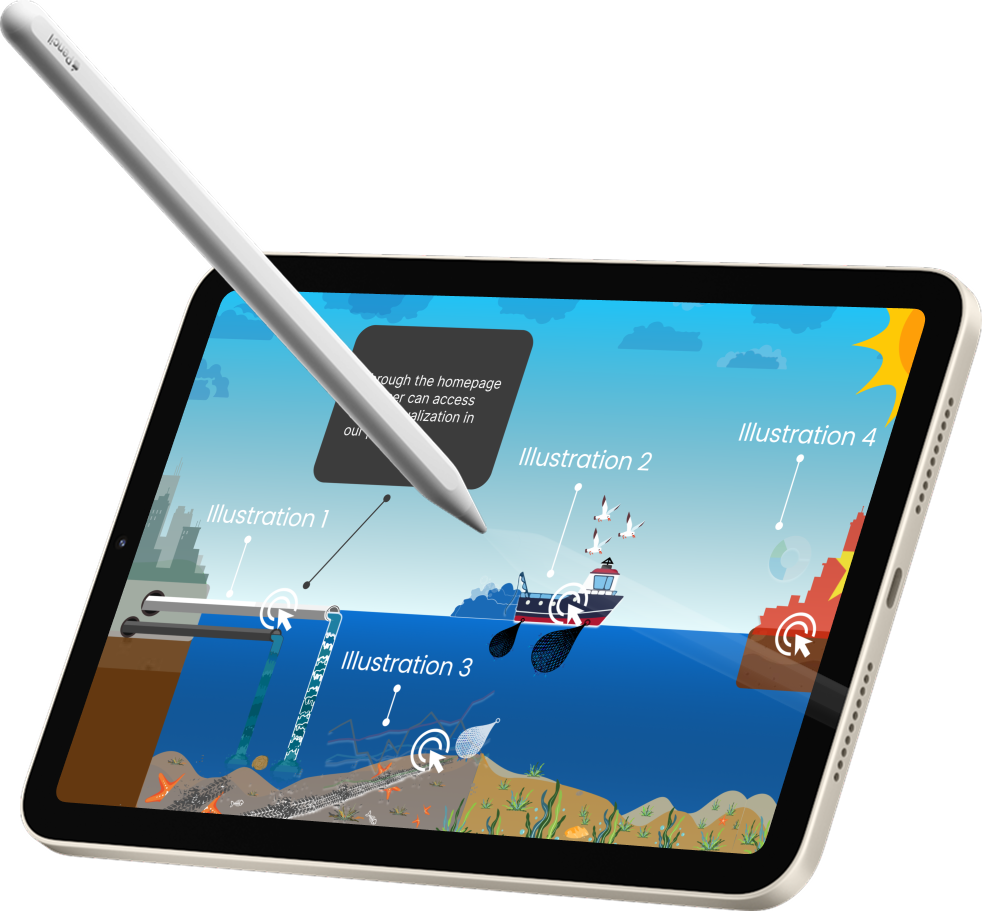
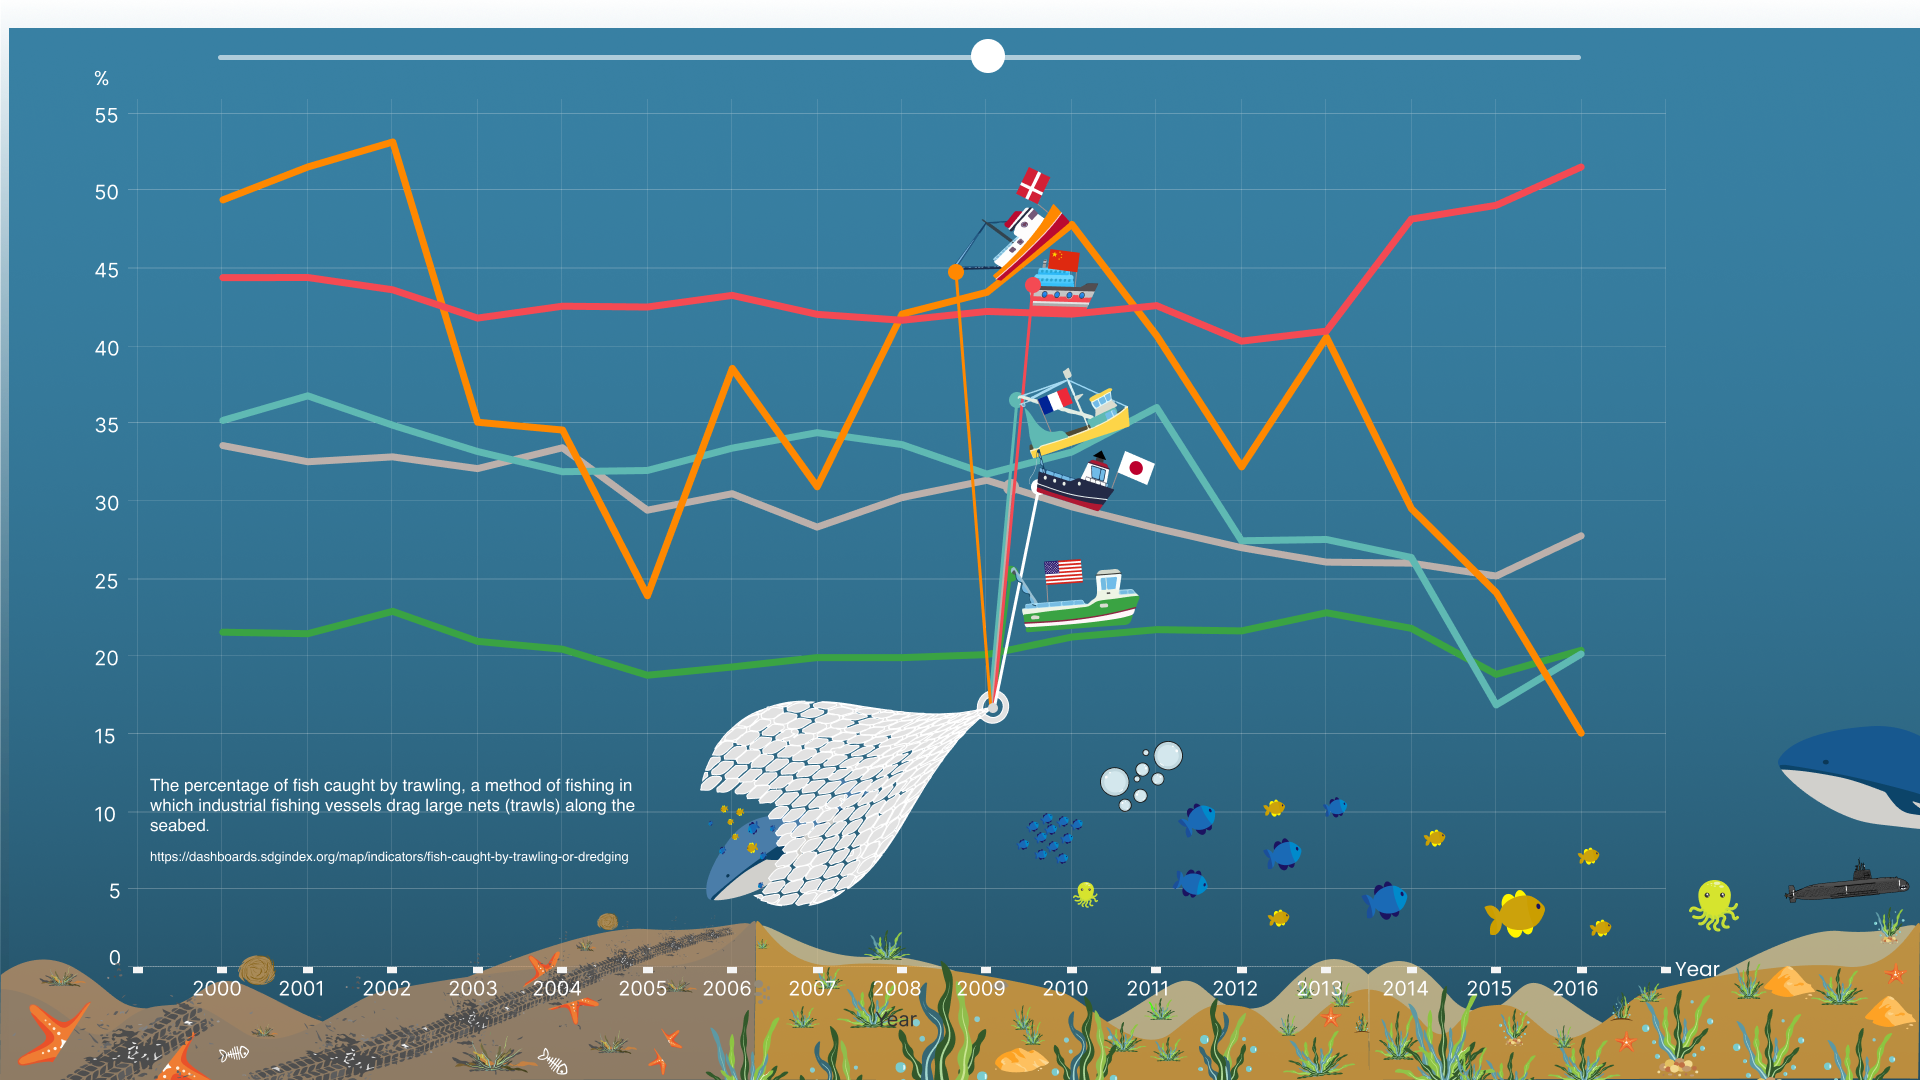
Solution:
Four different interactive visualisations showing issues related to life under water caused by humans.
Project Date_Spring 2022
Location: ITU
Other projects
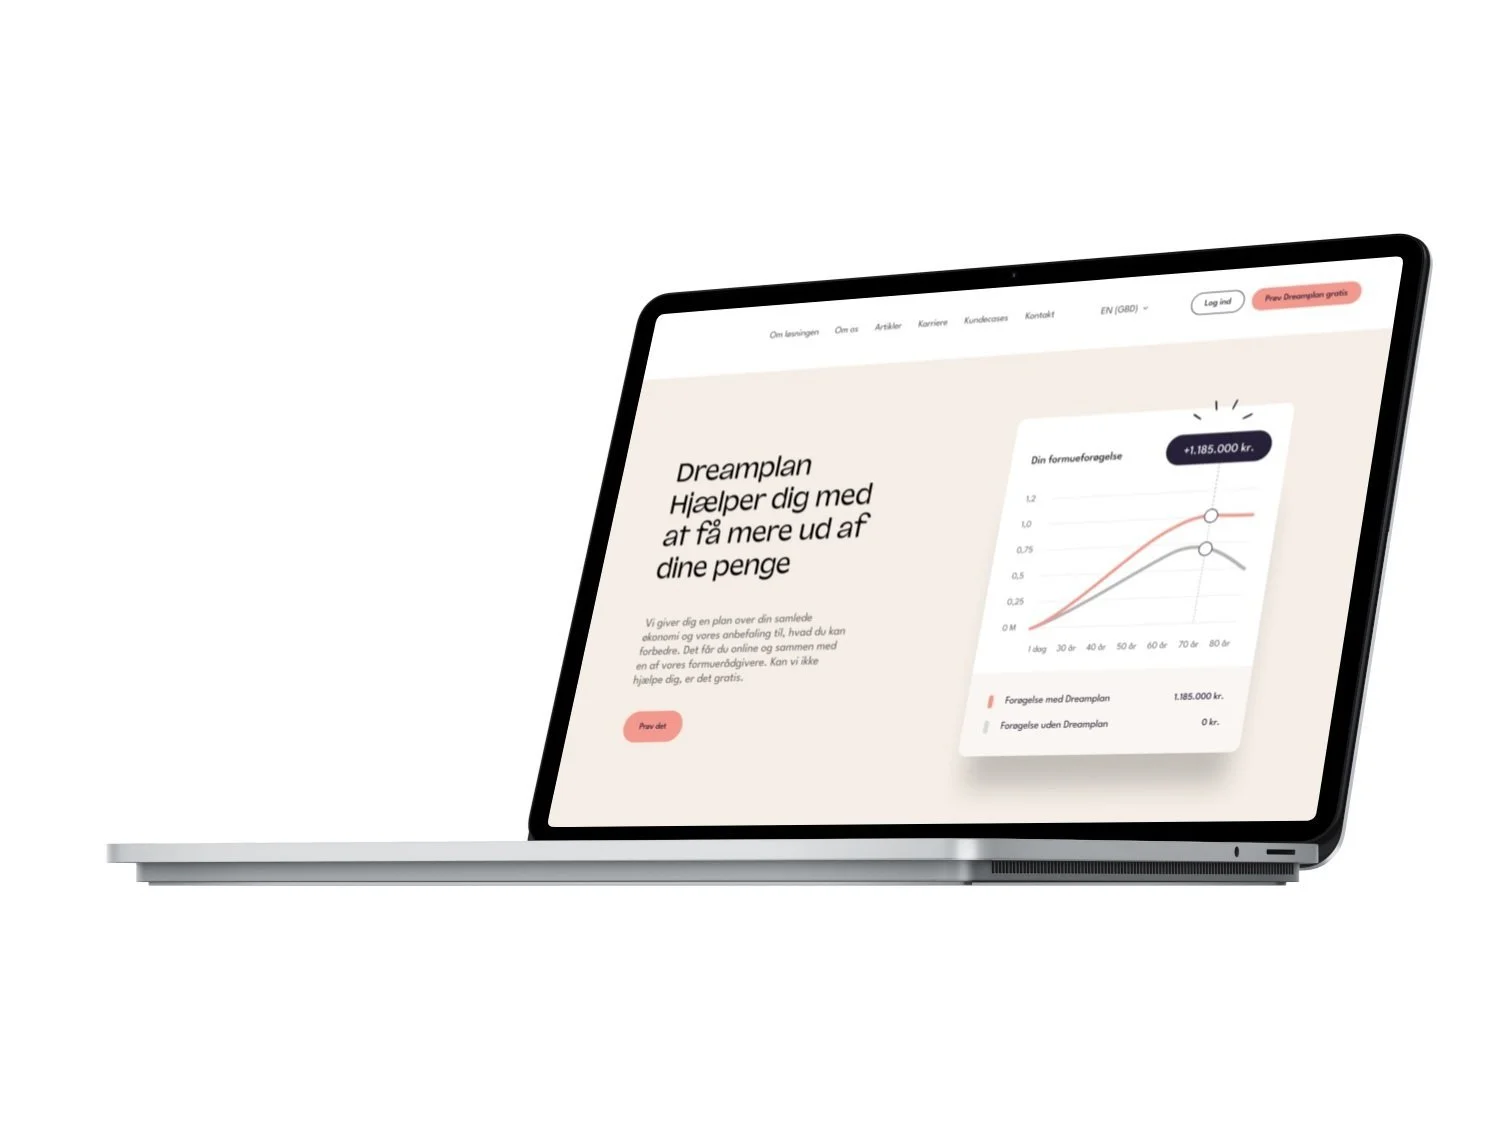
Dreamplan
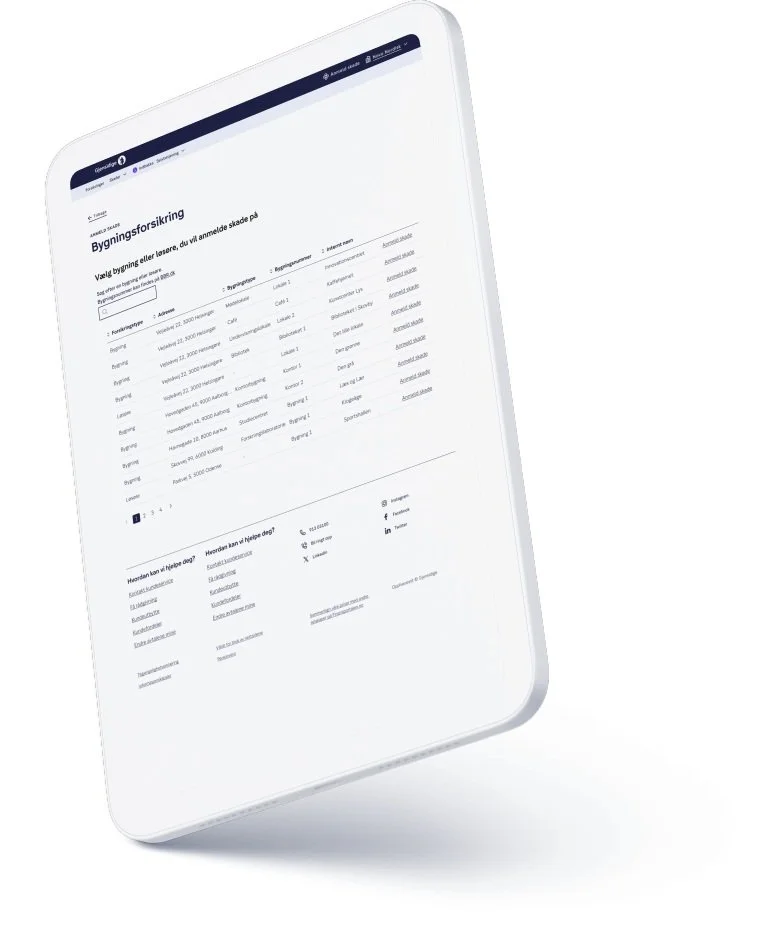
Gjensidige
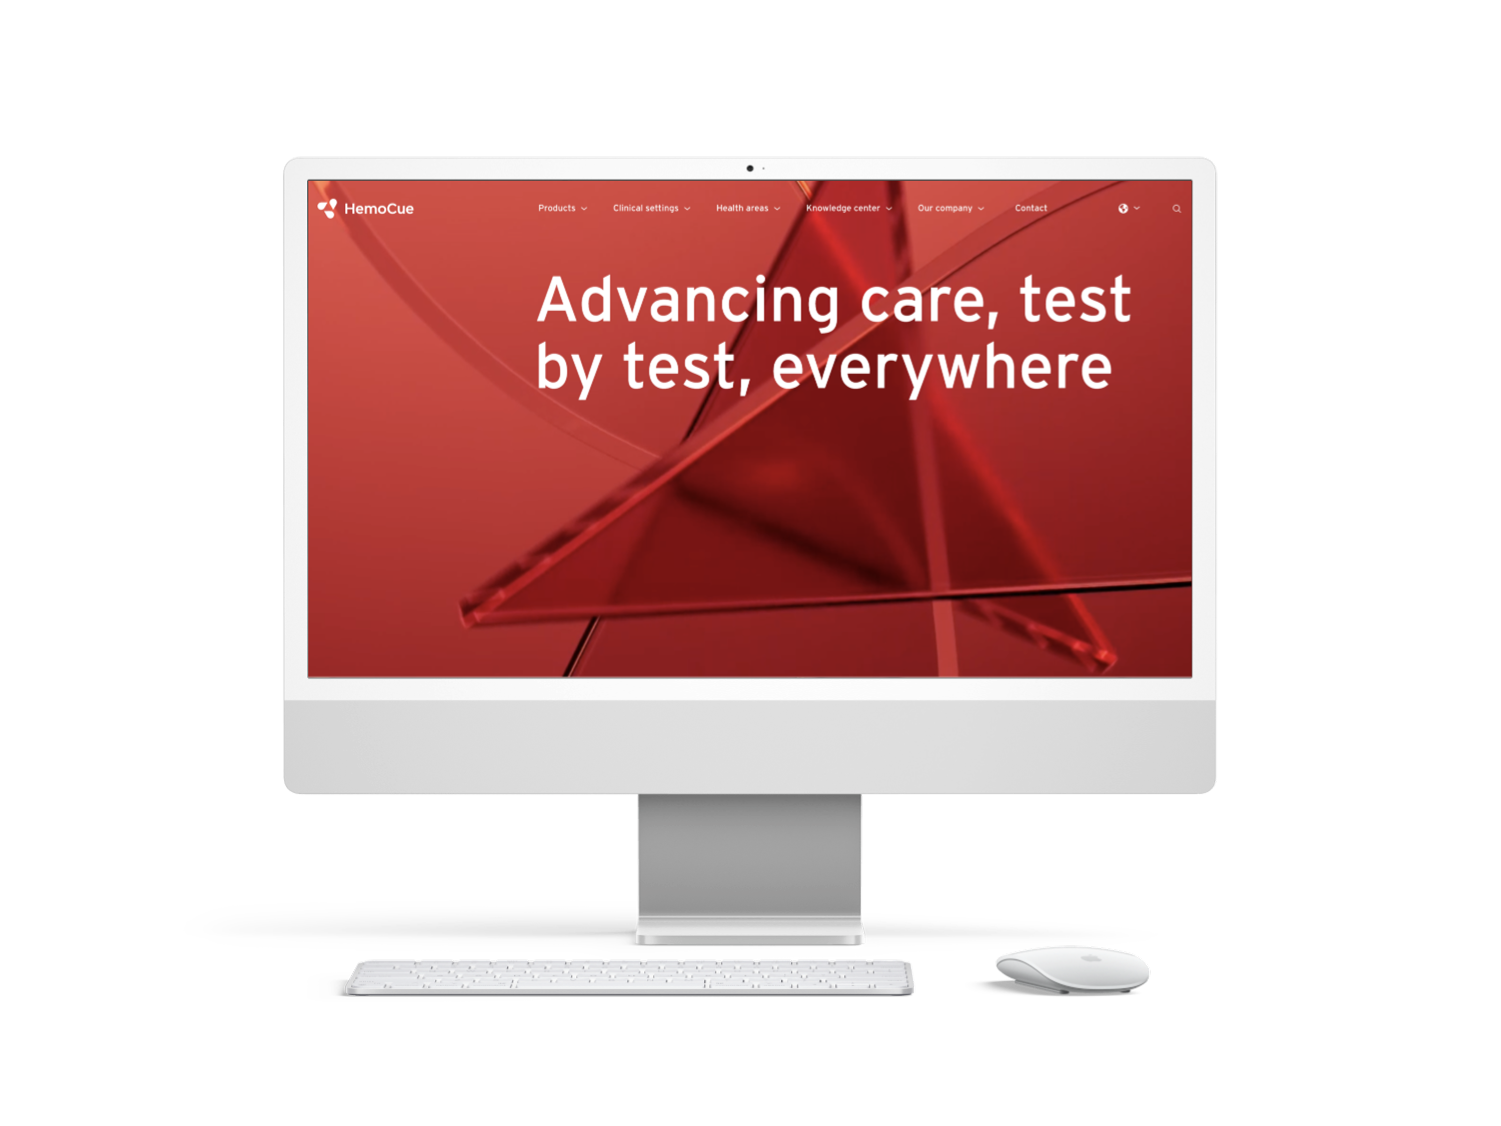
Hemocue
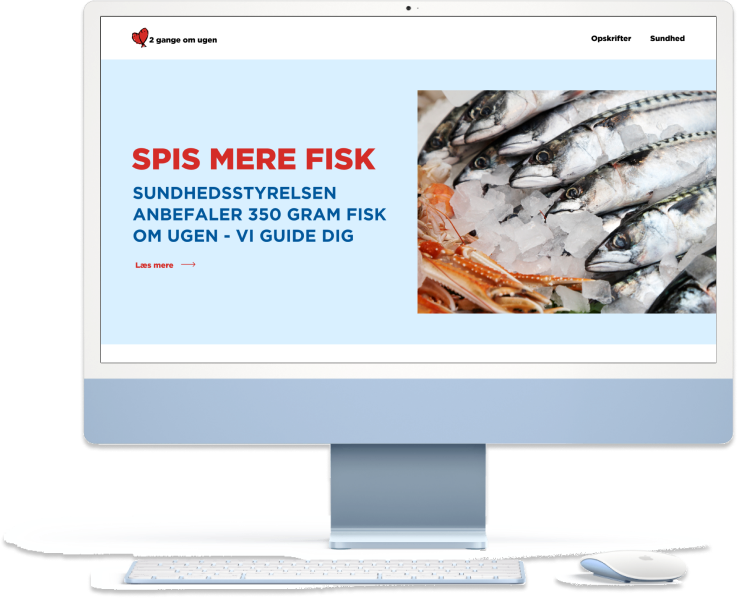
2gangeomugen
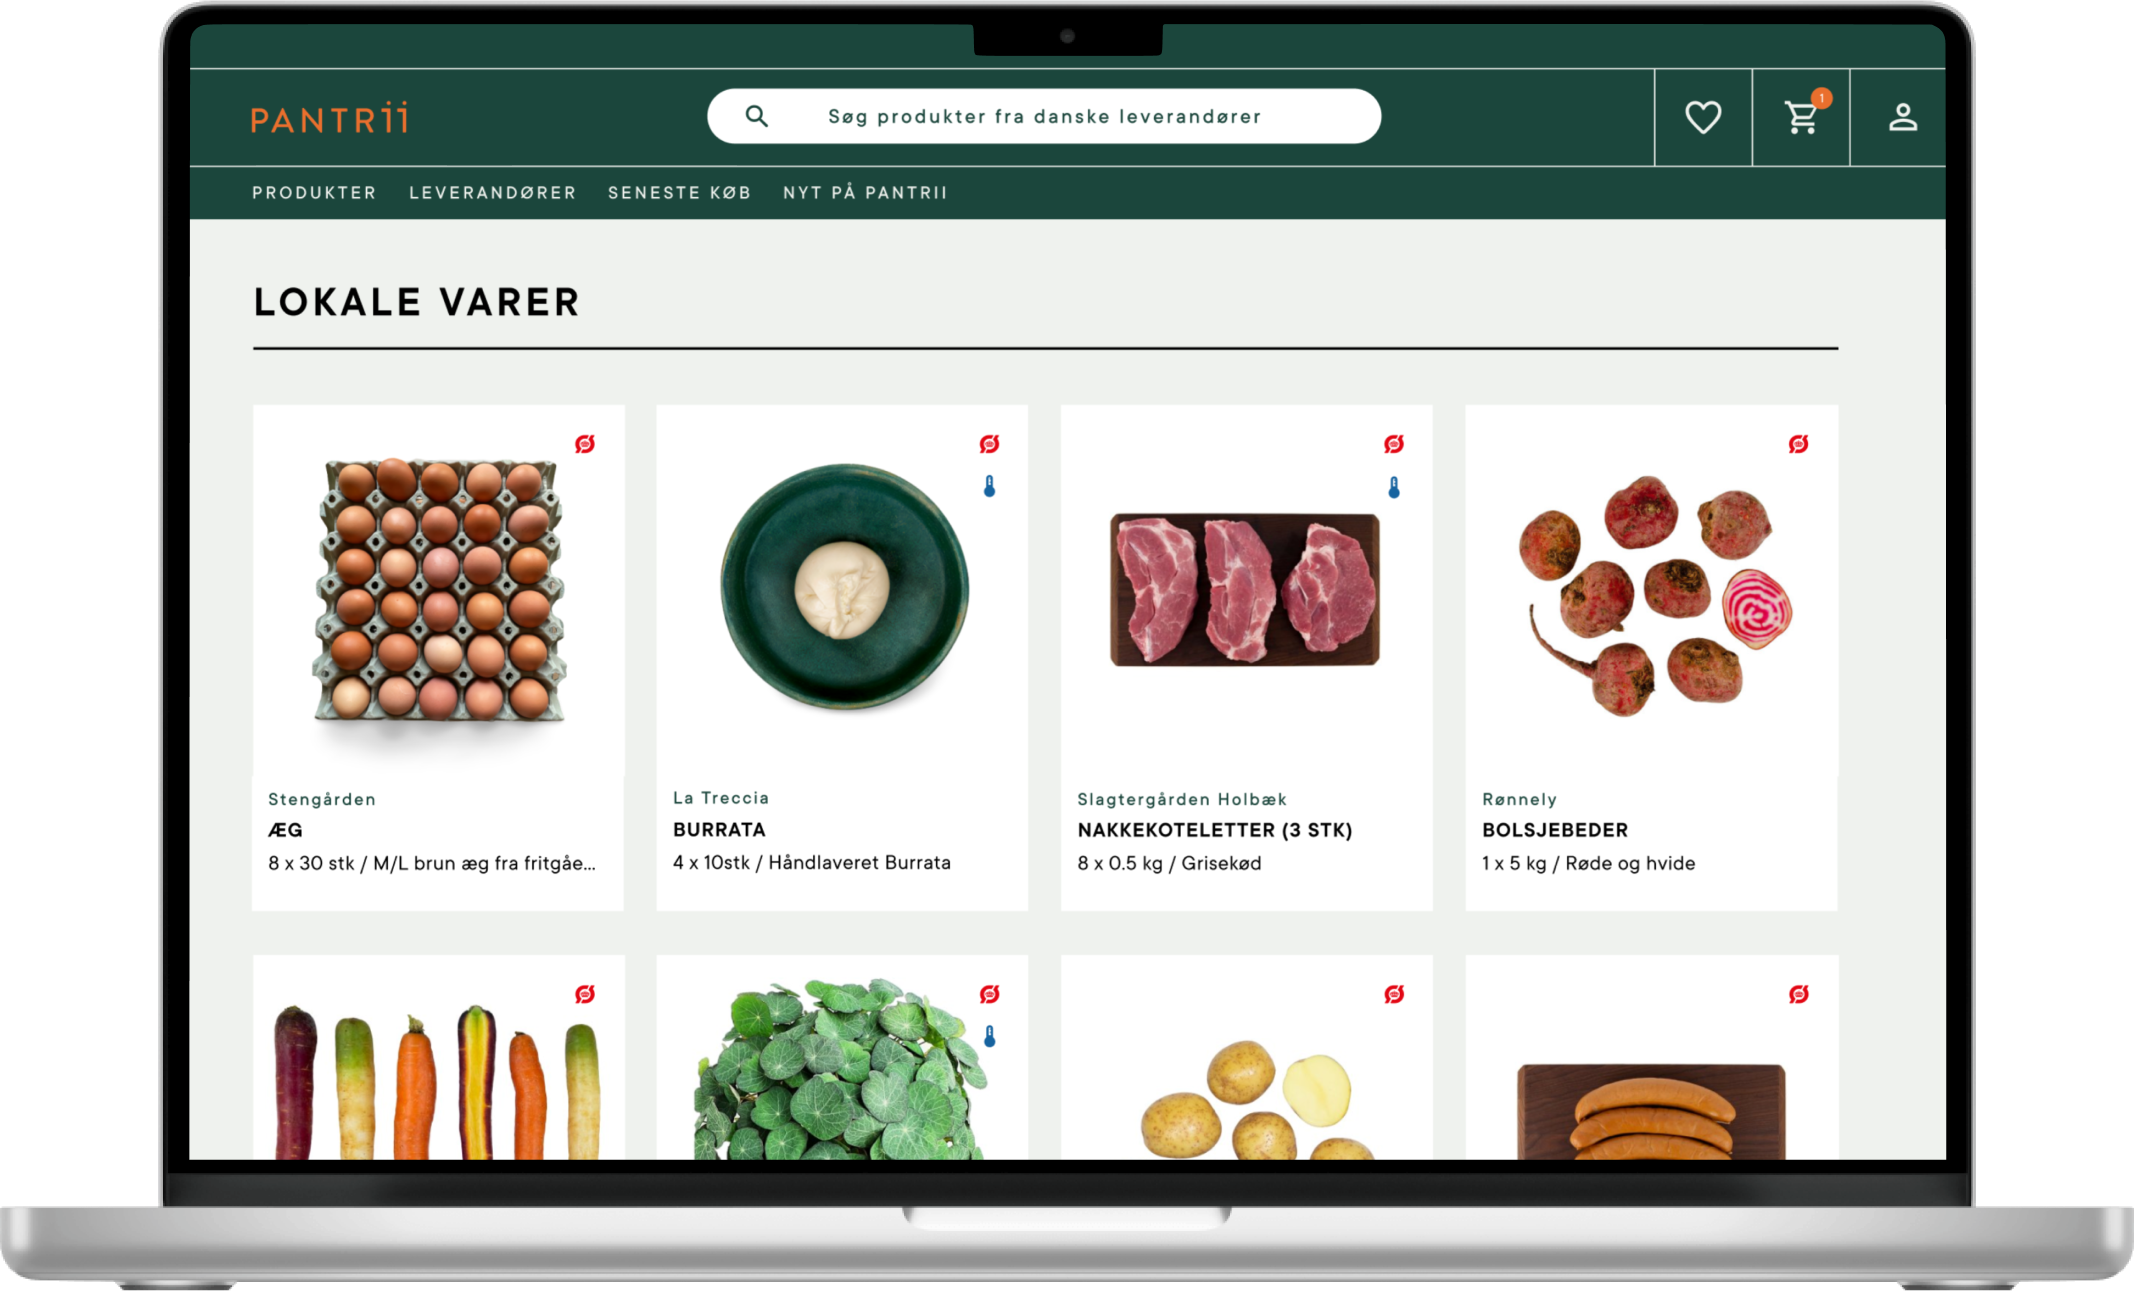
Pantrii